Upcoming earnings: BE · Thu Oct 22, 2026 after close · WDC · Thu Oct 22, 2026 after close · PYPL · Tue Oct 27, 2026 before open · SKHY · Tue Oct 27, 2026 after close · STX · Tue Oct 27, 2026 after close · EBAY · Wed Oct 28, 2026 after close · GOOGL · Wed Oct 28, 2026 after close · MSFT · Wed Oct 28, 2026 after close · NOW · Wed Oct 28, 2026 after close
Market today
Calm.
Sector streaks: Financials up 3 sessions in a row; Utilities up 3 sessions in a row
📌 TODAY'S FEATURED STOCK: NFLX
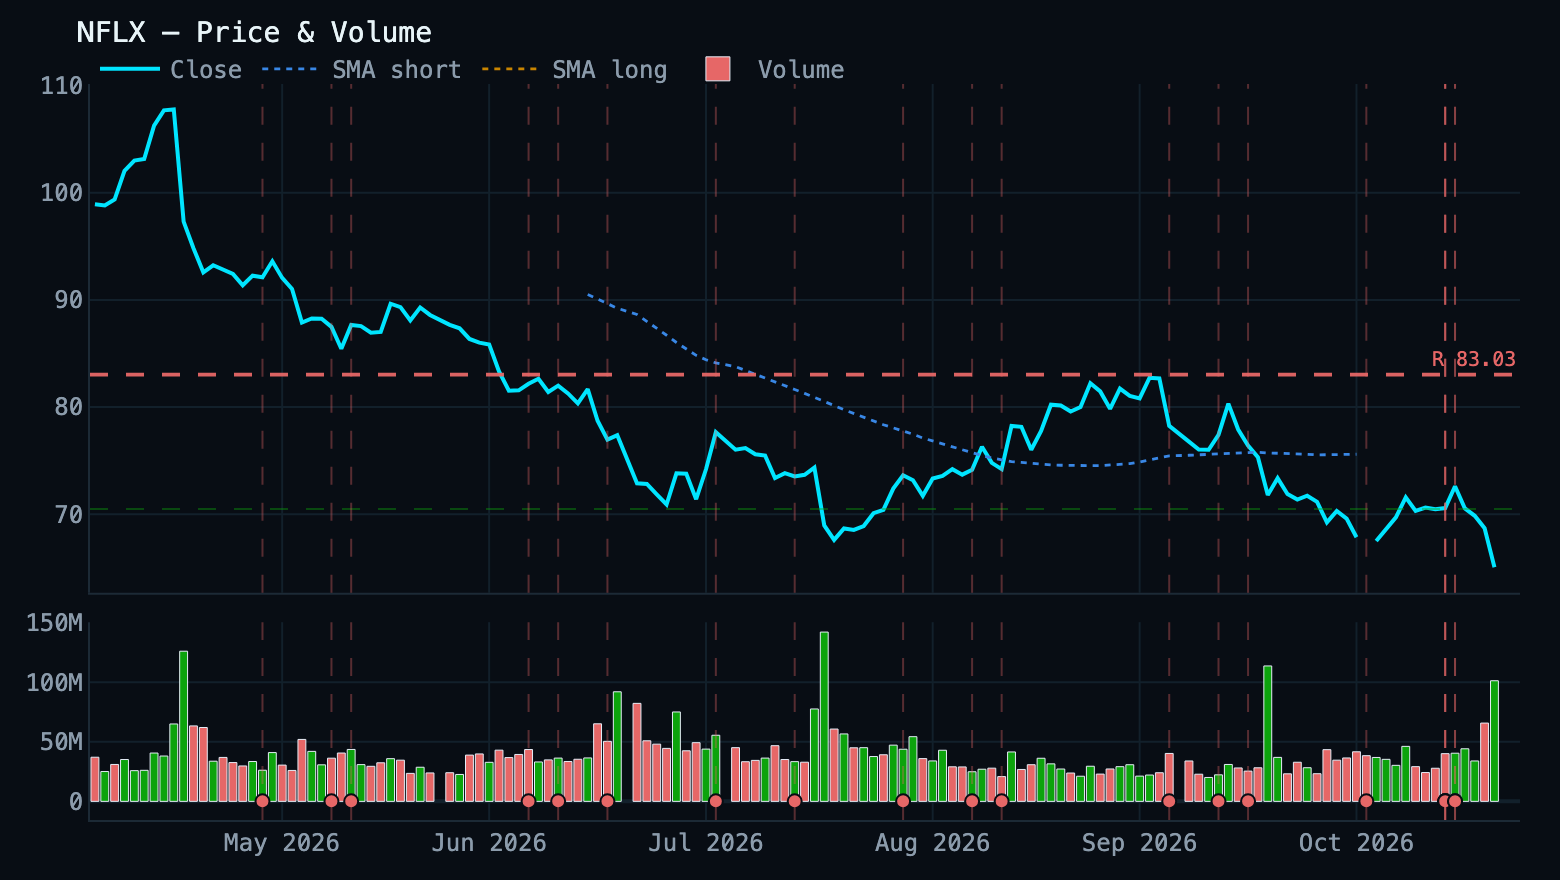
Current price: $66.01
Overview
NFLX trades at $66.01, up 1.5% on the day on 0.3× normal volume. It sits 43.5% below its 52-week high of $116.73 and is down 8.5% over the past month. Momentum is weak — RSI 36 with MACD still negative — and options are pricing a ±$3.31 (±5.0%) move over the next week.
Key Stats
2-Week Swing Outlook
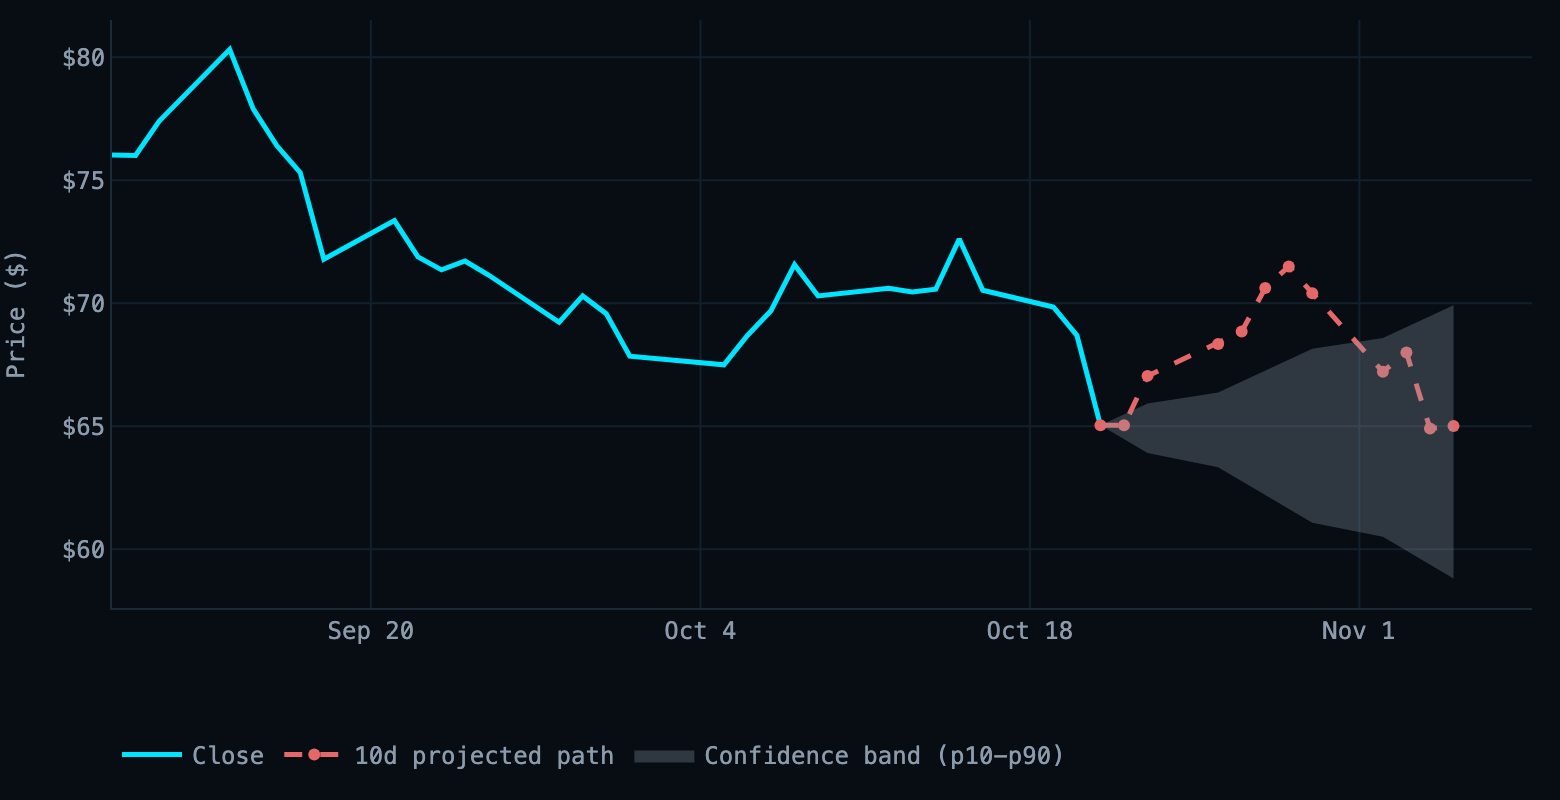
● DOWN — NFLX target $65.01 (-0.05%) by Nov 5, 2026 (10 trading days). Mode 3: trained model (1 reconciled 10-day session(s) on record, avg |error| 6.08%).
Institutional Analysis
| Insider activity | 8 sell(s), 0 buy(s) (last 90d) — largest: Director, $25.2M, Sep 1, 2026 |
| Buybacks | $9127M FY2025, up from $6264M FY2024 — ~3.37% of market cap |
| Analyst consensus | 43 analysts, Buy (mean 1.84) — target $85 vs $66 spot |
| Dark pool | 57.7% of volume, ELEVATED signal |
| Congressional | No trades on record |
Earnings
Latest reported (Oct 20, 2026): EPS Beat +6.10% / Revenue Beat 0.00%
News Summary
The dominant narrative is a pre-earnings sentiment break: Netflix was 'Downgraded To Sell Before Q3 Report' (Yahoo Finance, Oct 13, 2026) and 'double downgraded at Huber Research amid engagement, pricing concerns' the same day. TheStreet's 'Netflix faces unexpected challenge as streaming prices soar, customer interest shifts' (Oct 13, 2026) frames the same issue — pricing power running into softening engagement. Several pieces are explicitly relative-value framed against Disney ('Walt Disney vs. Netflix: Which Media Stock Is a Better Buy in 2026?'), consistent with DIS +1.3% YTD vs. NFLX -28.5%. Remaining headlines are routine MarketBeat 13F-flow notices (Davis Rea acquiring 25,000 shares; Kieckhefer Group selling 16,500).
Outlook
- Next earnings (Jan 19, 2027): NEUTRAL (Low confidence) — A fifth consecutive sell-the-beat reaction, as in Q1 2026's -9.72% move on a +62% EPS beat, would invalidate any valuation-based long thesis.
- End of this week (Oct 23, 2026): NEUTRAL (Low confidence) — Tech risk-off deepening (Nasdaq -1.42%, SOX -3.27%, VIX +7.91% today) could drag NFLX lower regardless of its company-specific bid.
- End of this month (Oct 31, 2026): BEARISH (Low confidence) — Deeply oversold positioning plus a $92.92 mean analyst target and 44.3% discount to the Nov 13, 2025 high of $116.73 could fuel a sharp value-driven bounce within the ±$4.42 (6.67%) 2-week expected move.
Recent News
- Here's Where Netflix and 3 Other Streaming and Media Stocks Could Be by 2030 — fool.com
- 25,000 Netflix, Inc. $NFLX Shares Acquired by Davis Rea LTD. — marketbeat.com
- Netflix faces unexpected challenge as streaming prices soar, customer interest shifts — thestreet.com
- Netflix Stock Downgraded To Sell Before Q3 Report — finance.yahoo.com
- Are You Overpaying For Disney Stock Versus Its Rivals? — trefis.com
Today's Runners (4)
- NFLX: $66.01 (+1.5%, 0.3× vol)
RSI 36 (approaching oversold), MACD histogram negative and falling → short-term bearish bias - RKLB: $52.11 (-2.9%, 0.1× vol)
RSI 31 (approaching oversold), MACD histogram negative and rising → short-term mixed/neutral bias - IREN: $26.10 (-6.2%, 0.3× vol)
RSI 26 (oversold), MACD histogram negative and rising → short-term bullish-reversal-risk bias - WDC: $366.63 (-3.1%, 0.2× vol)
RSI 40 (neutral), MACD histogram negative and rising → short-term mixed/neutral bias
Day Prediction targets (8)
| Ticker | Current | Target | Move | Dir | Conf. |
|---|---|---|---|---|---|
| SKHY ★ | $139.25 | $130.80 | -6.1% | ▼ | High |
| RKLB | $52.11 | $49.48 | -5.0% | ▼ | High |
| IREN | $26.10 | $24.79 | -5.0% | ▼ | Medium |
| WDC | $366.63 | $350.73 | -4.3% | ▼ | Medium |
| NOW ★ | $155.85 | $162.21 | +4.1% | ▲ | High |
| ORCL ★ | $127.73 | $124.63 | -2.4% | ▼ | Medium |
| NFLX | $66.01 | $67.61 | +2.4% | ▲ | High |
| MU ★ | $906.12 | $917.71 | +1.3% | ▲ | Medium |
Targets are model forecasts for today's 4:00 PM ET close, not guarantees. Confidence reflects backtest depth; per-ticker hit rates are in the dashboard.
Swing Forecast highlights (1)
- IREN (5d): target $25.09 (DOWN)
Watchlist Signals (full table) (21)
| Ticker | Price | Entry Zone | Distance | Signal | Model score (v4) |
|---|---|---|---|---|---|
| GOOGL | $328.33 | $322.28-$335.44 | IN ZONE | MIXED | 45 |
| INTC | $89.09 | $87.40-$90.96 | IN ZONE | UPGRADE | 38 |
| MU | $906.12 | $882.37-$918.39 | IN ZONE | MIXED | 5 |
| NFLX | $66.01 | $62.44-$67.64 | IN ZONE | MIXED | 11 |
| OKLO | $26.98 | $26.62-$28.84 | IN ZONE | MIXED | 13 |
| ORCL | $127.73 | $123.96-$134.30 | IN ZONE | QUIET | 15 |
| RKLB | $52.11 | $51.52-$55.82 | IN ZONE | MIXED | 11 |
| STX | $672.00 | $669.01-$724.77 | IN ZONE | MIXED | 19 |
| WDC | $366.63 | $363.37-$393.65 | IN ZONE | MIXED | 24 |
| SKHY | $139.25 | $132.31-$137.71 | +1.1% | QUIET | 28 |
| NVDA | $216.93 | $205.88-$214.28 | +1.2% | QUIET | 19 |
| TSM | $420.94 | $398.44-$414.70 | +1.5% | MIXED | 9 |
| IREN | $26.10 | $26.73-$28.95 | -2.4% | QUIET | 44 |
| BE | $229.01 | $210.27-$218.85 | +4.6% | MIXED | 6 |
| HIMS | $29.00 | $26.00-$27.06 | +7.2% | QUIET | 25 |
| PYPL | $57.43 | $50.48-$52.54 | +9.3% | MIXED | 40 |
| EBAY | $122.14 | $103.33-$107.55 | +13.6% | MIXED | 26 |
| META | $660.27 | $547.76-$570.12 | +15.8% | MIXED | 17 |
| LYFT | $17.17 | $14.20-$14.78 | +16.1% | MIXED | 29 |
| MSFT | $526.53 | $390.61-$406.55 | +29.5% | MIXED | 30 |
| NOW | $155.85 | $101.96-$106.12 | +46.9% | MIXED | 16 |
Macro Calendar — This Week & Next Week
Oct 19, 2026 – Oct 25, 2026
Oct 26, 2026 – Nov 1, 2026
Earnings tomorrow (2)
Earnings recap (1)
Earnings Simulator alerts (9)
- BE: Thu Oct 22, 2026, after close (next session)
- WDC: Thu Oct 22, 2026, after close (next session)
- PYPL: Tue Oct 27, 2026, before open (2 sessions)
- SKHY: Tue Oct 27, 2026, after close (3 sessions)
- STX: Tue Oct 27, 2026, after close (3 sessions)
- EBAY: Wed Oct 28, 2026, after close (4 sessions)
- GOOGL: Wed Oct 28, 2026, after close (4 sessions)
- MSFT: Wed Oct 28, 2026, after close (4 sessions)
- NOW: Wed Oct 28, 2026, after close (4 sessions)