Market today
Calm.
Sector streaks: Communication Services down 4 sessions in a row; Real Estate up 3 sessions in a row
📌 TODAY'S FEATURED STOCK: SKHY
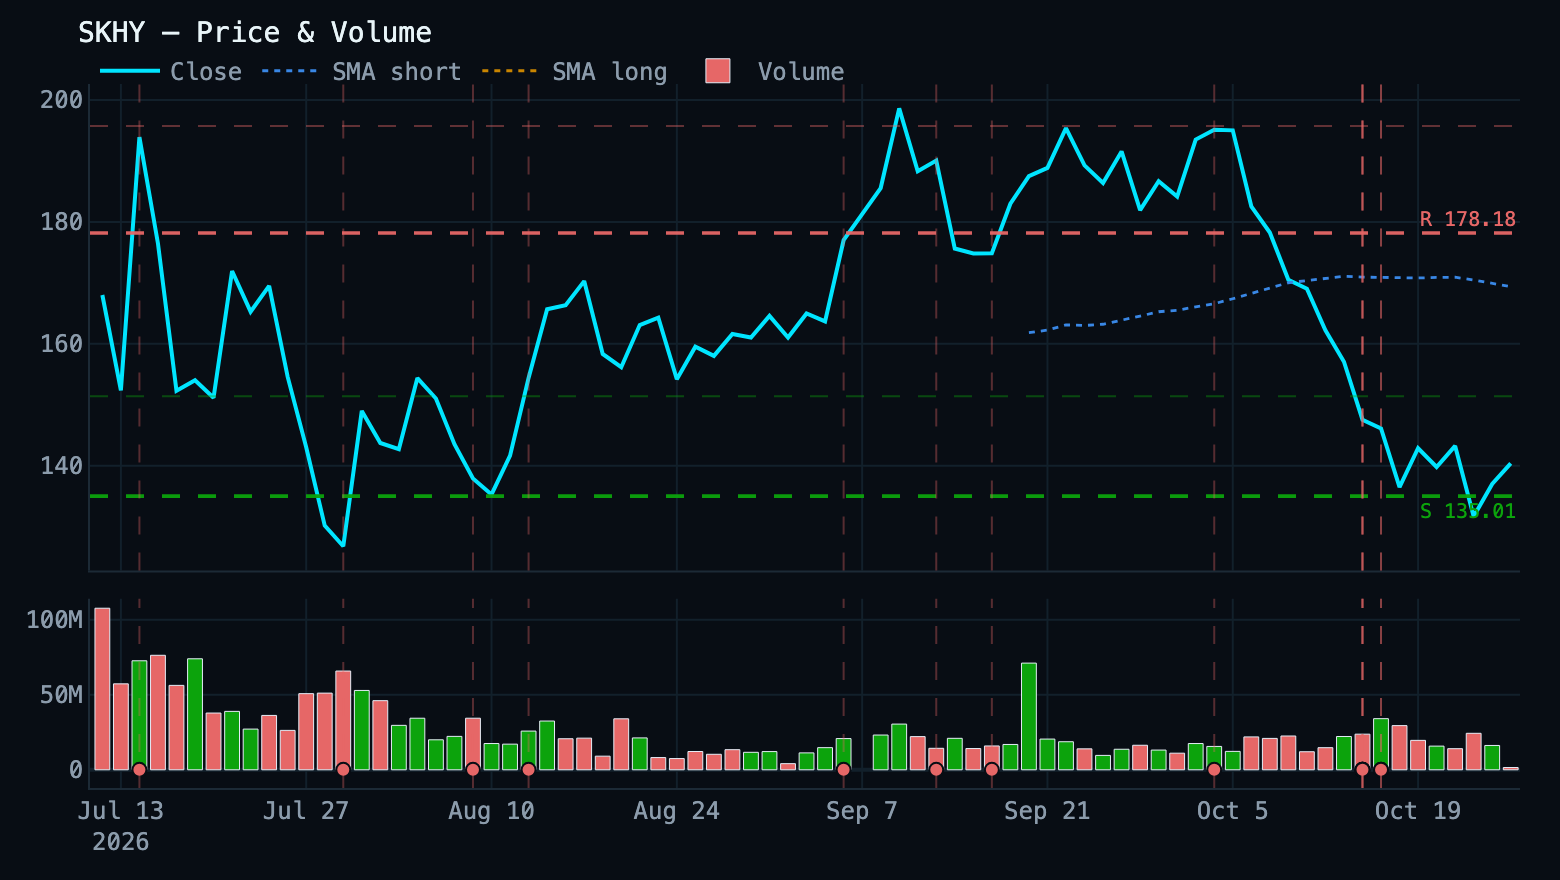
Current price: $139.68
Overview
SKHY trades at $139.68, up 1.9% on the day on 0.2× normal volume. It sits 30.1% below its 52-week high of $199.87 and is down 27.1% over the past month. Momentum is weak — RSI 37 with MACD still negative.
Key Stats
2-Week Swing Outlook
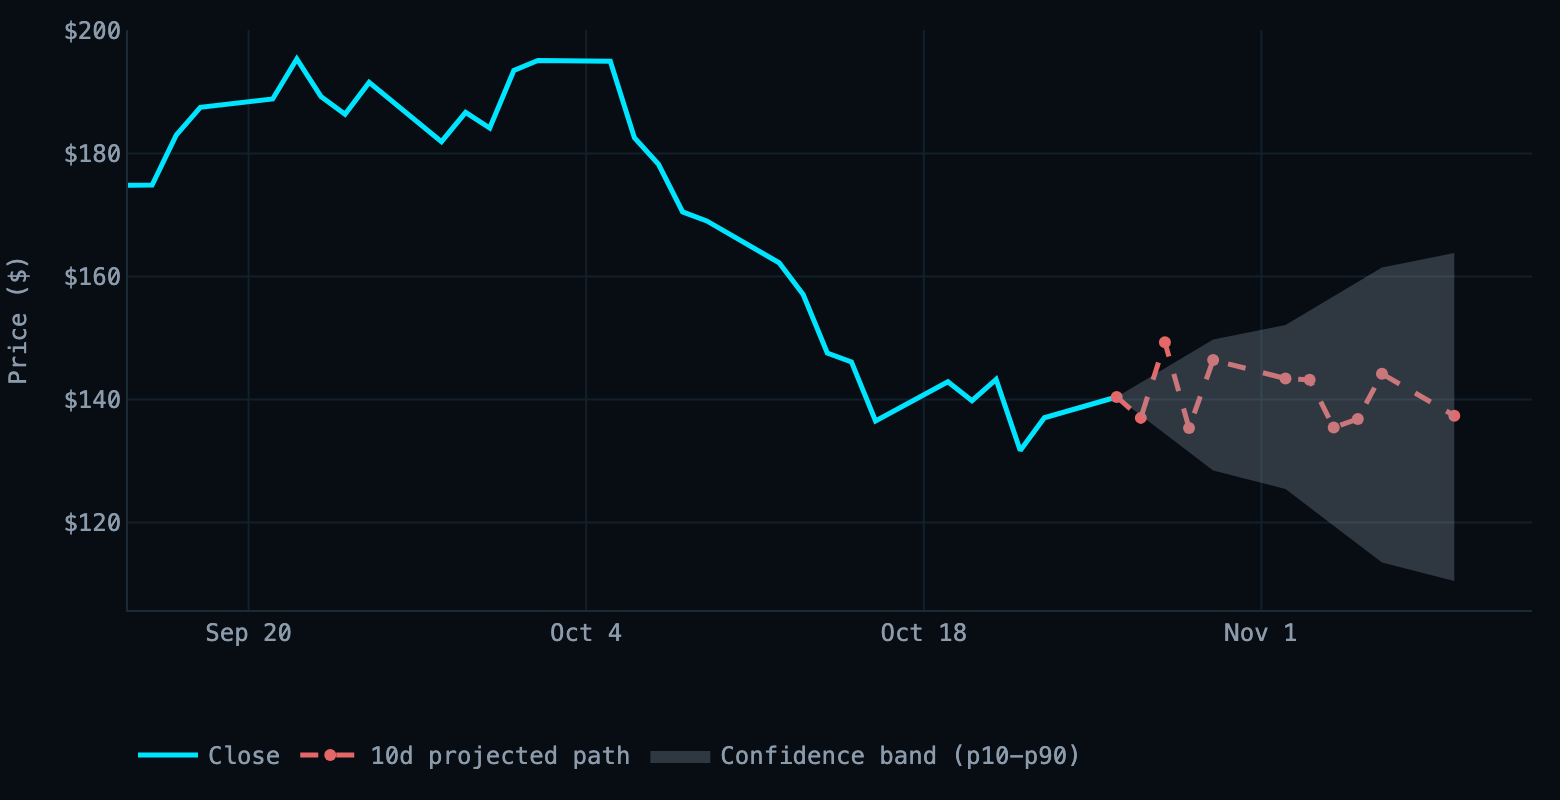
● DOWN — SKHY target $137.36 (-2.17%) by Nov 9, 2026 (10 trading days). Mode 3: trained model (35 reconciled 10-day session(s) on record, avg |error| 14.42%).
Institutional Analysis
| Analyst consensus | 14 analysts, Strong Buy (mean 1.47) — target $247 vs $137 spot |
| Dark pool | 35.9% of volume, NORMAL signal |
| Congressional | No trades on record |
Earnings
Latest reported (Jul 29, 2026): EPS Beat +71.09% / Revenue Miss -10.53%
News Summary
The dominant narrative is the mid-October AI/memory selloff and the debate over whether it's a buying opportunity: headlines on Oct 16, 2026 covered SKHY, SanDisk and Micron dropping 3% despite Goldman Sachs calling China chip fears overdone, a Goldman note flagging two memory stocks to buy into the pullback, and a direct MU-vs-SKHY comparison piece. SKHY itself was down 6.6% in one session on Oct 16, 2026 amid the AI-angst-fueled rout. China exposure is a live second thread \u2014 SK hynix is seeking Washington approval to export US chip equipment to China (tikr.com, Oct 16, 2026). Most recently, Cantor Fitzgerald cut its price target on Oct 27, 2026, a day before the report.
Outlook
- Next earnings (Oct 27, 2026): NEUTRAL (Low confidence) — A revenue miss like July's -10.53% without an offsetting EPS beat could break 135.01.
- End of this week (Oct 30, 2026): NEUTRAL (Low confidence) — Earnings gap could overwhelm technical structure in either direction within two sessions.
- End of this month (Oct 31, 2026): BULLISH (Low confidence) — Beta 2.391 means any renewed AI-angst selloff like October 16's -6.6% day hits hard.
Recent News
- SK hynix (NASDAQ:SKHY) Stock Gets Price Target Reduction from Cantor Fitzgerald — marketbeat.com
- Lancaster Investment Management Purchases 185,194 Shares of SK hynix Inc. $SKHY — marketbeat.com
- SK hynix (NASDAQ:SKHY) Shares Down 6.6% - Should You Sell? — marketbeat.com
- Stocks struggle to bounce back from AI angst-fueled rout — finance.yahoo.com
- The Buying Opportunities Hidden in the Chip Stock Chaos — finance.yahoo.com
Today's Runners (2)
- BE: $197.59 (+2.2%, 0.3× vol)
RSI 35 (approaching oversold), MACD histogram negative and rising → short-term mixed/neutral bias - IREN: $24.21 (-2.8%, 0.4× vol)
RSI 24 (oversold), MACD histogram negative and rising → short-term bullish-reversal-risk bias
Day Prediction targets (7)
| Ticker | Current | Target | Move | Dir | Conf. |
|---|---|---|---|---|---|
| BE | $197.59 | $213.20 | +7.9% | ▲ | Medium |
| SKHY ★ | $139.68 | $145.85 | +4.4% | ▲ | Medium |
| MU ★ | $887.96 | $922.31 | +3.9% | ▲ | Medium |
| NOW ★ | $156.21 | $151.91 | -2.7% | ▼ | Medium |
| ORCL ★ | $124.04 | $121.36 | -2.2% | ▼ | High |
| IREN | $24.21 | $24.65 | +1.8% | ▲ | Low |
| WDC ★ | $343.89 | $345.55 | +0.5% | ▲ | Low |
Targets are model forecasts for today's 4:00 PM ET close, not guarantees. Confidence reflects backtest depth; per-ticker hit rates are in the dashboard.
Watchlist Signals (full table) (21)
| Ticker | Price | Entry Zone | Distance | Signal | Model score (v4) |
|---|---|---|---|---|---|
| BE | $197.59 | $185.57-$201.03 | IN ZONE | MIXED | 39 |
| GOOGL | $318.29 | $307.40-$333.02 | IN ZONE | MIXED | 32 |
| IREN | $24.21 | $23.91-$25.91 | IN ZONE | QUIET | 43 |
| NFLX | $65.04 | $63.30-$65.88 | IN ZONE | MIXED | 44 |
| OKLO | $25.53 | $25.30-$27.40 | IN ZONE | MIXED | 18 |
| ORCL | $124.04 | $121.11-$131.21 | IN ZONE | MIXED | 16 |
| RKLB | $52.63 | $50.50-$54.70 | IN ZONE | MIXED | 30 |
| STX | $626.41 | $605.27-$655.71 | IN ZONE | MIXED | 32 |
| WDC | $343.89 | $329.92-$357.42 | IN ZONE | MIXED | 28 |
| INTC | $86.97 | $83.20-$86.60 | +0.4% | UPGRADE | 23 |
| HIMS | $27.31 | $26.00-$27.06 | +0.9% | QUIET | 12 |
| SKHY | $139.68 | $132.31-$137.71 | +1.4% | QUIET | 44 |
| TSM | $421.18 | $398.44-$414.70 | +1.6% | MIXED | 23 |
| MU | $887.96 | $834.70-$868.76 | +2.2% | MIXED | 8 |
| PYPL | $55.79 | $50.48-$52.54 | +6.2% | MIXED | 45 |
| NVDA | $214.60 | $193.32-$201.22 | +6.6% | QUIET | 11 |
| EBAY | $120.19 | $103.33-$107.55 | +11.8% | MIXED | 75 |
| META | $631.85 | $527.96-$549.50 | +15.0% | MIXED | 1 |
| LYFT | $17.06 | $14.20-$14.78 | +15.4% | MIXED | 58 |
| MSFT | $524.57 | $390.61-$406.55 | +29.0% | MIXED | 33 |
| NOW | $156.21 | $100.39-$104.49 | +49.5% | MIXED | 30 |
Earnings tomorrow (1)
Implied move ±7.7% $51.54 – $60.09, from the Oct 30 straddle | Average move, last 8 ±8.0% bigger than implied in 4 of 8 |
Consensus EPS $1.31 revenue $8.71B | EPS record beat 7 of 8 avg move after beats −3.3%, after misses −20.3% |
| Position | Rule set A P&L | Rule set B P&L | Δ (shares) |
|---|---|---|---|
| Call 58 · Nov 6 × 4 | −$172.00 | −$172.00 | ≈ +185 |
| Call 57 · Nov 6 × 3 | −$100.50 | −$100.50 | ≈ +159 |
| Long 175 shares | +$33.25 | +$33.25 | ≈ +175 |
Earnings recap (2)
Implied move ±9.7% $206.85 – $251.15, from the Oct 23 straddle | Average move, last 8 ±11.2% bigger than implied in 3 of 8 |
Consensus EPS $0.67 revenue $1.07B | EPS record beat 7 of 8 avg move after beats +6.0%, after misses +23.4% |
Actual move vs implied −11.2% vs implied ±9.7%: moved more than implied · open gap −6.8% · $217.77 → $193.30 | IV before → after 102% → 84% −18 pts, at-the-money |
| Position | Rule set A P&L | Rule set B P&L |
|---|---|---|
| Call 230 · Nov 6 | −$1,006.00 (stop hit) | −$1,006.00 |
| Call 240 · Nov 6 | −$790.50 (stop hit) | −$790.50 (stop hit) |
| Call 225 · Nov 6 | −$1,155.00 (stop hit) | −$1,155.00 |
| Long 45 shares | −$1,101.15 (stop hit) | −$1,101.15 |
| Long 42 shares | −$1,027.74 (stop hit) | −$1,027.74 (stop hit) |
| Long 43 shares | −$1,052.21 (stop hit) | −$1,052.21 |
Implied move ±7.9% $337.51 – $395.16, from the Oct 23 straddle | Average move, last 8 ±7.5% bigger than implied in 5 of 8 |
Consensus EPS $4.10 revenue $4.15B | EPS record beat 7 of 8 avg move after beats +1.1%, after misses +4.7% |
Actual move vs implied −3.0% vs implied ±7.9%: fell short · open gap −2.3% · $354.19 → $343.67 | IV before → after 83% → 70% −13 pts, at-the-money |
| Position | Rule set A P&L | Rule set B P&L |
|---|---|---|
| Call 365 · Nov 6 | −$837.50 | −$837.50 |
| Put 360 · Nov 6 | +$215.00 | +$215.00 |
| Long 28 shares | −$294.56 | −$294.56 |
| Short 27 shares | +$283.91 | +$283.91 |
Calendar — This Week & Next Week
Oct 26, 2026 – Nov 1, 2026
Nov 2, 2026 – Nov 8, 2026