Market today
Calm.
Sector streaks: Materials up 6 sessions in a row; Consumer Staples up 3 sessions in a row; Real Estate up 3 sessions in a row
📌 TODAY'S FEATURED STOCK: ORCL
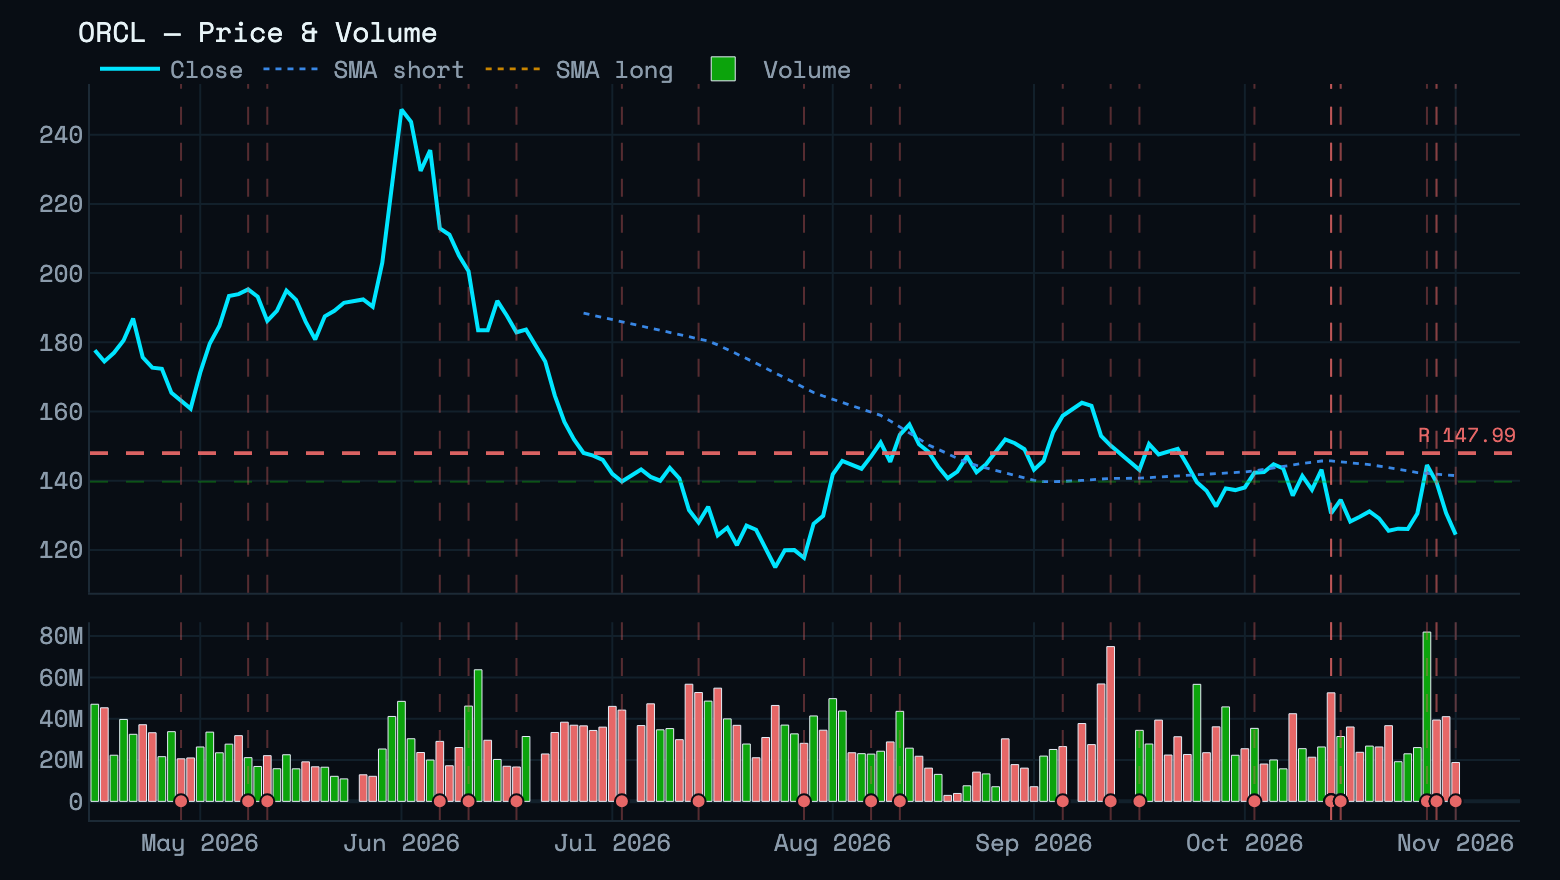
Current price: $124.60
Overview
ORCL trades at $124.60, down 4.6% on the day on 0.6× normal volume. It sits 52.5% below its 52-week high of $262.11 and is down 12.1% over the past month. Momentum is weak — RSI 42 with MACD positive.
Key Stats
2-Week Swing Outlook
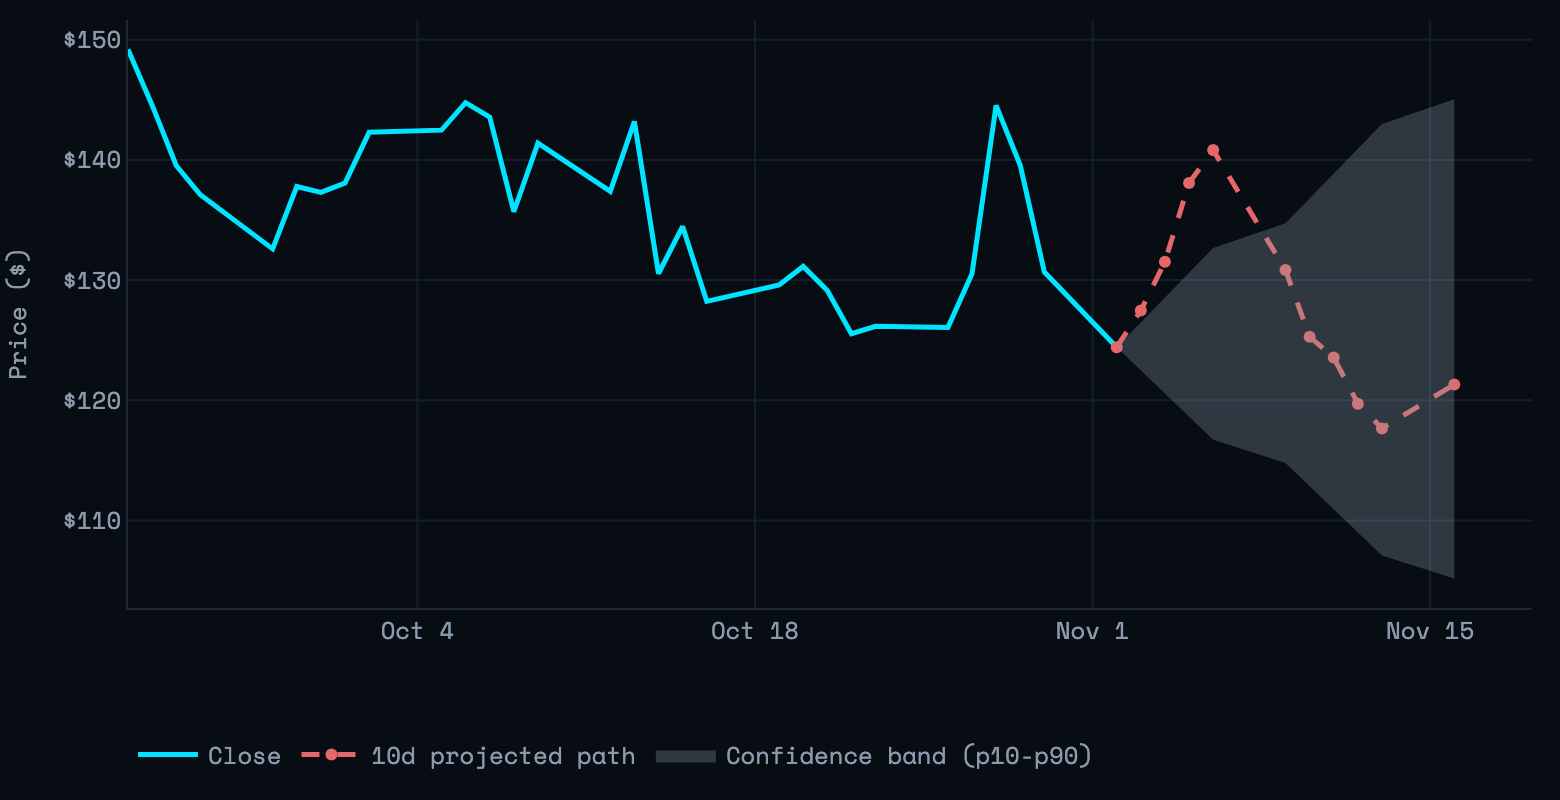
● DOWN — ORCL target $121.32 (-2.49%) by Nov 16, 2026 (10 trading days).
Institutional Analysis
| Insider activity | 3 sell(s), 0 buy(s) (last 90d) — largest: Chief Executive Officer, $5.2M, Sep 21, 2026 |
| Buybacks | $206M FY2026, down from $1500M FY2025 — ~0.05% of market cap |
| Analyst consensus | 41 analysts, Buy (mean 1.58) — target $236 vs $124 spot |
| Dark pool | 41.1% of volume, NORMAL signal |
| Congressional | No trades on record |
Earnings
Latest reported (Sep 10, 2026): EPS Beat +10.34% / Revenue Beat +1.15%
News Summary
One narrative dominates: Oracle is raising capital to fund its AI buildout and the market is repricing the balance sheet risk. Today brought a shelf registration, a filing to offer $10B of common stock and a $10B bond sale, with headlines framing the drop as 'AI debt worries' revived (247wallst, Yahoo Finance, Nov 2, 2026). Moody's affirmed the Baa2 rating on the new notes but kept a negative outlook (FinancialJuice, Nov 2, 2026). That sits directly on top of the FY2026 cash picture — $55.66B CapEx against $31.98B operating cash flow — making financing structure, not AI demand, the swing variable.
Outlook
- Next earnings (Dec 14, 2026): NEUTRAL (Medium confidence) — Another guidance-driven gap like the -10.83% reaction on Dec 10, 2025.
- End of this week (Nov 6, 2026): BEARISH (Medium confidence) — Calm regime and Stephens' Nov 2, 2026 upgrade could spark a dip-buying bounce.
- End of this month (Nov 30, 2026): BEARISH (Low confidence) — $235.80 mean target and 27 reiterations leave room for sharp sentiment reversal.
Recent News
- Oracle Stock Falls on $20 Billion Raise — finance.yahoo.com
- Oracle Opens Door to Fresh Capital Raise With Shelf Registration — finance.yahoo.com
- Veteran Silicon Valley Executive Lorie Boyd Joins Kodiak AI as Chief People Officer — finance.yahoo.com
- Oracle shares fall after $10 billion stock offering — finance.yahoo.com
- Oracle Declines 4% as $10 Billion Bond Sale Revives AI Debt Worries; CoreWeave Advances 2%, Microsoft Holds Steady — 247wallst.com
Today's Runners (4)
- ORCL: $124.60 (-4.6%, 0.6× vol)
RSI 42 (neutral), MACD histogram positive and falling → short-term mixed/neutral bias - SKHY: $155.23 (+4.0%, 0.3× vol)
RSI 48 (neutral), MACD histogram positive and rising → short-term bullish bias - LYFT: $16.92 (+4.7%, 0.2× vol)
RSI 56 (neutral), MACD histogram negative and rising → short-term mixed/neutral bias - DUOL: $136.52 (+3.8%, 0.2× vol)
RSI 45 (neutral), MACD histogram negative and rising → short-term mixed/neutral bias
Day Prediction targets (8)
| Ticker | Current | Target | Move | Dir | Conf. |
|---|---|---|---|---|---|
| WDC ★ | $357.30 | $334.75 | -6.3% | ▼ | Medium |
| ORCL | $124.60 | $117.73 | -5.5% | ▼ | Medium |
| MU ★ | $880.10 | $852.46 | -3.1% | ▼ | Low |
| INTC ★ | $64.25 | $62.37 | -2.9% | ▼ | Low |
| NOW ★ | $108.07 | $111.17 | +2.9% | ▲ | Medium |
| LYFT | $16.92 | $17.31 | +2.3% | ▲ | Medium |
| DUOL | $136.52 | $138.56 | +1.5% | ▲ | Medium |
| SKHY | $155.23 | $157.20 | +1.3% | ▲ | Low |
Targets are model forecasts for today's 4:00 PM ET close, not guarantees. Confidence reflects backtest depth; per-ticker hit rates are in the dashboard.
Watchlist Signals (full table) (29)
| Ticker | Price | Entry Zone | Distance | Signal | Model score (v4) |
|---|---|---|---|---|---|
| AMD | $504.49 | $488.73-$508.67 | IN ZONE | MIXED | 30 |
| GLD | $362.07 | $341.55-$370.01 | IN ZONE | QUIET | 25 |
| GOOGL | $285.64 | $268.65-$291.03 | IN ZONE | MIXED | 30 |
| HOOD | $86.47 | $81.59-$88.39 | IN ZONE | MIXED | 20 |
| INTC | $64.25 | $63.13-$68.39 | IN ZONE | MIXED | 11 |
| IREN | $24.12 | $22.99-$24.91 | IN ZONE | QUIET | 20 |
| NBIS | $153.95 | $147.97-$160.31 | IN ZONE | QUIET | 6 |
| NFLX | $61.78 | $59.60-$64.56 | IN ZONE | DOWNGRADE | 47 |
| OKLO | $25.86 | $24.24-$26.26 | IN ZONE | MIXED | 23 |
| RKLB | $54.74 | $52.54-$56.92 | IN ZONE | MIXED | 12 |
| SNDK | $1,139.71 | $1,104.85-$1,196.93 | IN ZONE | MIXED | 3 |
| STX | $619.59 | $618.80-$670.36 | IN ZONE | MIXED | 22 |
| WDC | $357.30 | $351.47-$380.75 | IN ZONE | MIXED | 22 |
| ORCL | $124.60 | $125.98-$131.12 | -1.1% | MIXED | 14 |
| MU | $880.10 | $834.70-$868.76 | +1.3% | QUIET | 19 |
| NOW | $108.07 | $102.06-$106.22 | +1.7% | MIXED | 2 |
| HIMS | $27.58 | $26.00-$27.06 | +1.9% | QUIET | 32 |
| VST | $139.70 | $131.16-$136.52 | +2.3% | MIXED | 25 |
| NVDA | $209.24 | $193.32-$201.22 | +4.0% | QUIET | 14 |
| TSM | $410.43 | $376.38-$391.74 | +4.8% | MIXED | 4 |
| BE | $208.19 | $183.71-$191.21 | +8.9% | MIXED | 15 |
| PYPL | $58.47 | $50.48-$52.54 | +11.3% | DOWNGRADE | 23 |
| META | $617.30 | $527.96-$549.50 | +12.3% | MIXED | 12 |
| SKHY | $155.23 | $132.31-$137.71 | +12.7% | MIXED | 11 |
| LYFT | $16.92 | $14.20-$14.78 | +14.4% | MIXED | 46 |
| EBAY | $123.33 | $103.33-$107.55 | +14.7% | UPGRADE | 14 |
| DUOL | $136.52 | $110.50-$115.02 | +18.7% | MIXED | 1 |
| SMCI | $33.29 | $25.01-$26.03 | +27.9% | MIXED | 50 |
| MSFT | $527.78 | $390.61-$406.55 | +29.8% | MIXED | 5 |
EPS vs consensus $0.52 vs $0.40 +30.6% surprise · beat | Revenue vs consensus n/a not in Yahoo's quarterly statement yet; consensus $16.49B |
Result Beat EPS only; revenue n/a | Guidance weak outlook (Intel Server Sales Jump 78%, Q4 Outlook Dims: Rapid Earnings Reaction) |
Open gap −25.8% $92.07 prior close → $68.36 open | First close −28.6% $92.07 → $65.76 on Fri Oct 30, 2026 |
vs implied move 3.2× implied moved more than the implied ±8.9% |
Implied move before ±8.9% $84.62 – $101.22, Oct 30 straddle | Average move, last 8 ±9.3% bigger than implied in 2 of 8 |
EPS record beat 5 of 7 avg move after beats −0.8%, after misses −0.4% |
EPS vs consensus $49.51 vs $46.41 +6.7% surprise · beat | Revenue vs consensus n/a not in Yahoo's quarterly statement yet |
Result Beat EPS only; revenue n/a | Guidance raised (Why Sandisk Stock Plunged Today) |
Open gap −8.6% $1,330.05 prior close → $1,215.09 open | First close −13.5% $1,330.05 → $1,150.89 on Fri Oct 30, 2026 |
vs implied move n/a no options snapshot before the report |
Implied move before n/a no options snapshot before the report | Average move, last 6 ±7.8% no implied move to compare |
EPS record beat 6 of 6 avg move after beats +4.0% |
Calendar — This Week & Next Week
Nov 2, 2026 – Nov 8, 2026
Nov 9, 2026 – Nov 15, 2026