Market today
Calm.
Sector streaks: Communication Services down 6 sessions in a row; Semiconductors up 4 sessions in a row; Technology up 4 sessions in a row; Consumer Staples down 4 sessions in a row
📌 TODAY'S FEATURED STOCK: RKLB
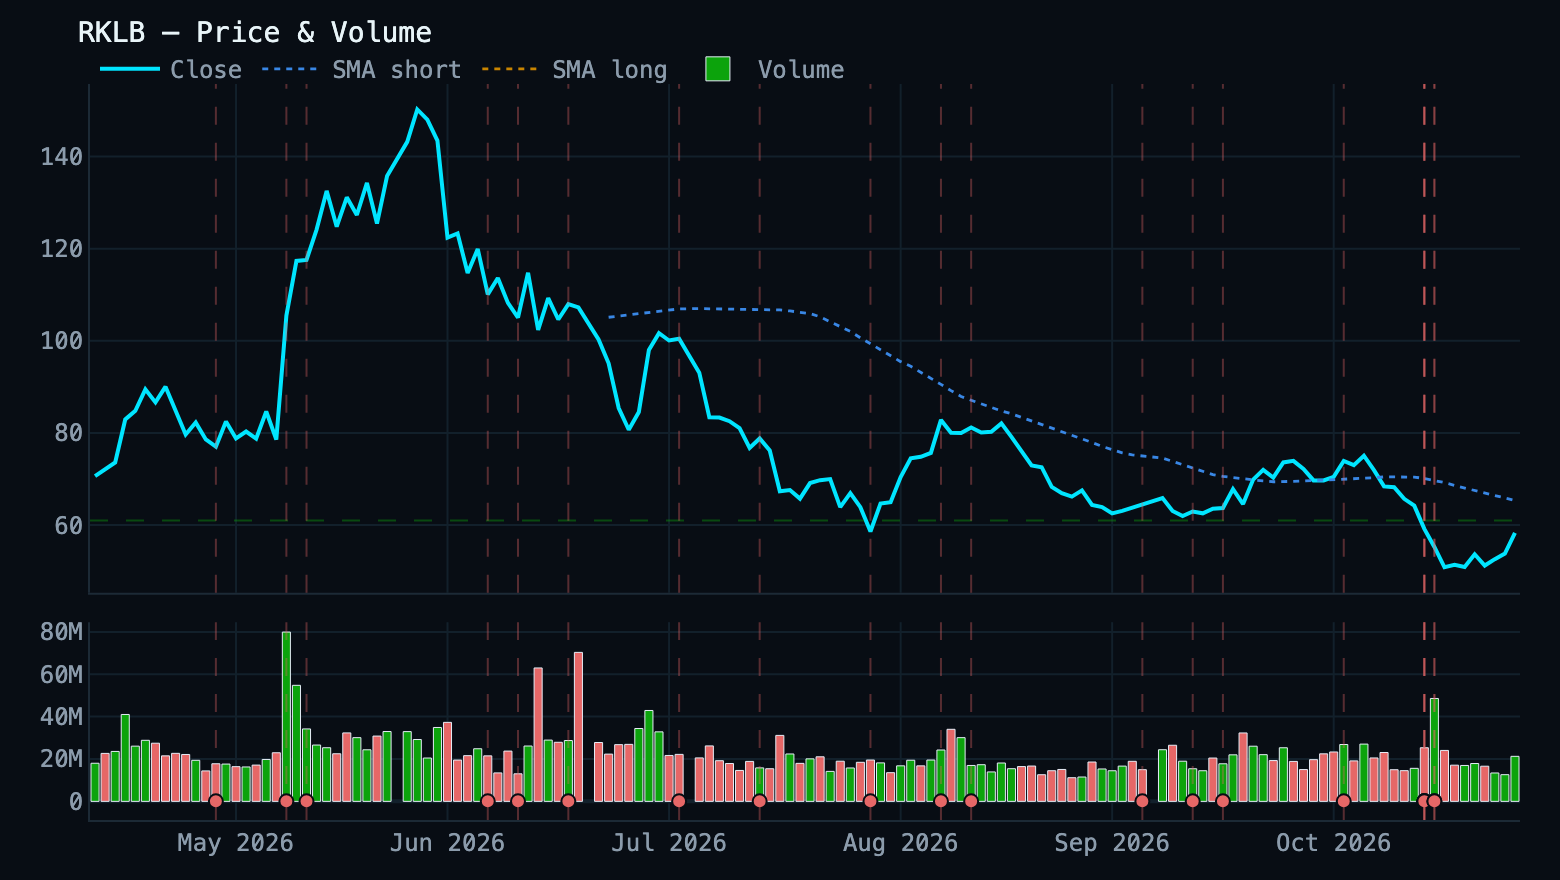
Current price: $57.34
Overview
RKLB trades at $57.34, down 1.7% on the day on 0.1× normal volume. It sits 62.0% below its 52-week high of $151.00 and is down 20.6% over the past month. Momentum is weak — RSI 44 with MACD still negative — and options are pricing a ±$6.39 (±11.1%) move over the next week.
Key Stats
2-Week Swing Outlook
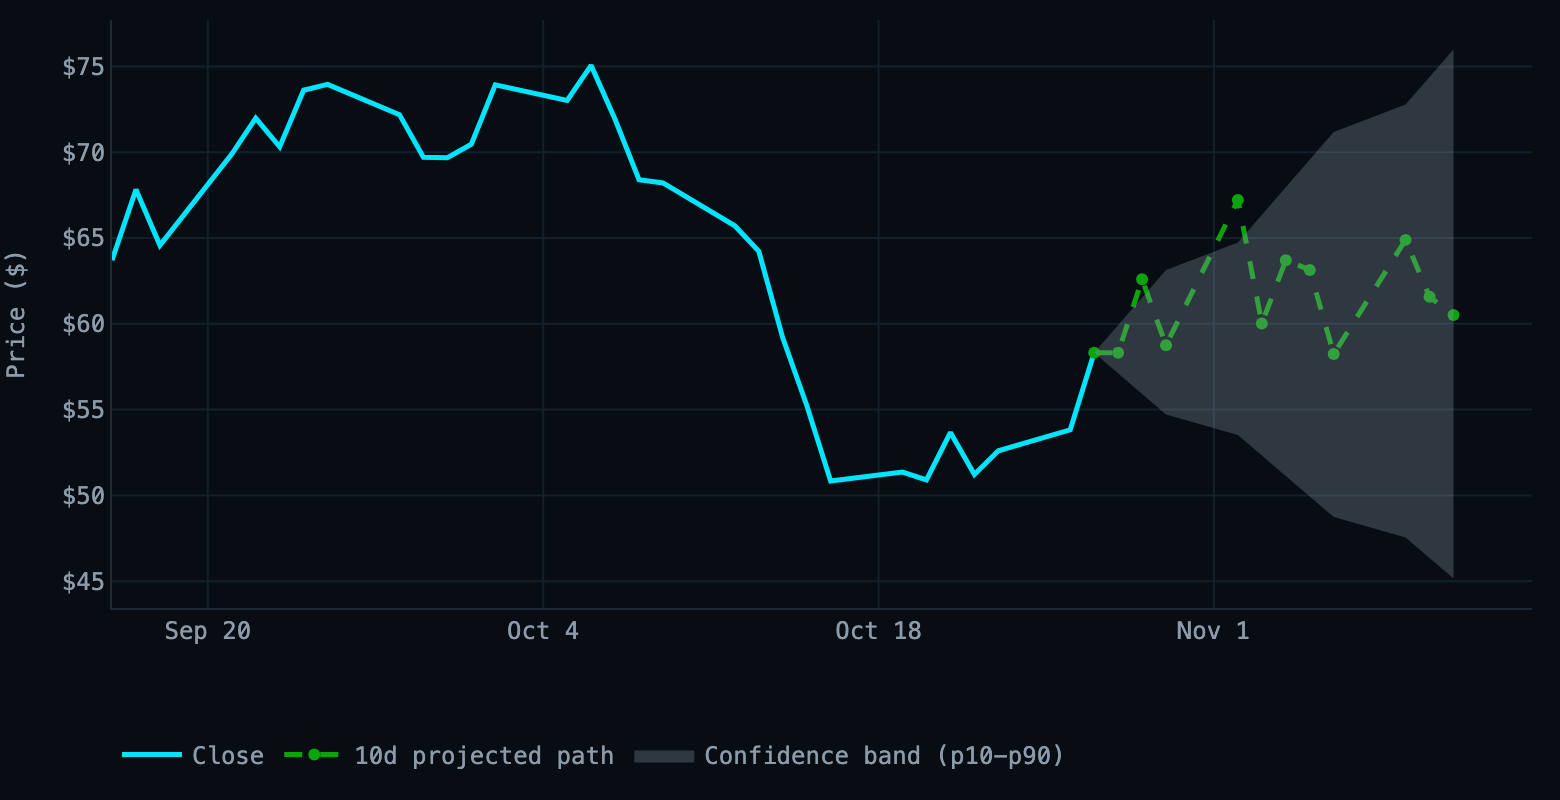
● UP — RKLB target $60.51 (+3.77%) by Nov 11, 2026 (10 trading days). Mode 3: trained model (214 reconciled 10-day session(s) on record, avg |error| 18.87%).
Institutional Analysis
| Insider activity | 25 sell(s), 0 buy(s) (last 90d) — largest: Chief Financial Officer, $6.0M, Oct 1, 2026 |
| Buybacks | $0M FY2025, flat vs. $0M FY2024 — ~0.00% of market cap |
| Analyst consensus | 20 analysts, Buy (mean 1.59) — target $102 vs $57 spot |
| Dark pool | 39.1% of volume, NORMAL signal |
| Congressional | No trades on record |
Earnings
Latest reported (Aug 10, 2026): EPS Miss -37.22% / Revenue Beat +1.06%
News Summary
The RSS feed is thin — only two MarketBeat price-move recaps (+8.3% on Oct 27, 2026, +2.3% on Oct 26, 2026), which explains the +6.47% five-session move with no fundamental news attached. The real narrative sits in the catalyst research: everything hinges on Neutron's first flight, with Stage 1 tank production aligned to a Q4 2026 Wallops LC-3 pad delivery and management conceding the year-end debut window 'is narrowing.' On the revenue side, the $816M SDA Tracking Layer Tranche 3 prime award and the closed Mynaric acquisition scale Space Systems, but fixed-price government work dilutes gross margin. That margin/loss tension is precisely what drove the ~10% Q2 2026 intraday drop despite 62% revenue growth and a record $2.36B backlog.
Outlook
- Next earnings (Nov 9, 2026): NEUTRAL (Low confidence) — Neutron timeline slippage commentary could repeat the Q2 margin-driven selloff.
- End of this week (Oct 30, 2026): NEUTRAL (Medium confidence) — A 10.94% one-week implied move means even quiet tape can swing sharply.
- End of this month (Oct 31, 2026): NEUTRAL (Medium confidence) — Heavy CFO selling — 140,157 shares on Oct 1, 2026 — weighs on any rally attempt.
Recent News
- Rocket Lab (NASDAQ:RKLB) Shares Climb 8.3% - Here's Why — marketbeat.com
- Rocket Lab (NASDAQ:RKLB) Shares Up 2.3% - Here's What Happened — marketbeat.com
Today's Runners (4)
- RKLB: $57.34 (-1.7%, 0.1× vol)
RSI 44 (neutral), MACD histogram negative and rising → short-term mixed/neutral bias - IREN: $27.38 (-0.2%, 0.3× vol)
RSI 34 (approaching oversold), MACD histogram negative and rising → short-term mixed/neutral bias - WDC: $384.99 (+1.1%, 0.2× vol)
RSI 48 (neutral), MACD histogram positive and rising → short-term bullish bias - META: $618.49 (-0.3%, 0.3× vol)
RSI 32 (approaching oversold), MACD histogram negative and rising → short-term mixed/neutral bias
Day Prediction targets (8)
| Ticker | Current | Target | Move | Dir | Conf. |
|---|---|---|---|---|---|
| IREN | $27.38 | $25.69 | -6.2% | ▼ | High |
| SKHY ★ | $162.38 | $167.68 | +3.3% | ▲ | Medium |
| RKLB | $57.34 | $55.47 | -3.3% | ▼ | Medium |
| MU ★ | $977.99 | $1,007.59 | +3.0% | ▲ | Medium |
| ORCL ★ | $130.54 | $128.09 | -1.9% | ▼ | Medium |
| META | $618.49 | $607.32 | -1.8% | ▼ | Medium |
| NOW ★ | $153.44 | $155.94 | +1.6% | ▲ | Medium |
| WDC | $384.99 | $386.06 | +0.3% | ▲ | Low |
Targets are model forecasts for today's 4:00 PM ET close, not guarantees. Confidence reflects backtest depth; per-ticker hit rates are in the dashboard.
Watchlist Signals (full table) (21)
| Ticker | Price | Entry Zone | Distance | Signal | Model score (v4) |
|---|---|---|---|---|---|
| IREN | $27.38 | $26.34-$28.54 | IN ZONE | QUIET | 26 |
| NFLX | $61.81 | $60.02-$65.02 | IN ZONE | MIXED | 31 |
| OKLO | $26.67 | $26.24-$28.42 | IN ZONE | MIXED | 28 |
| ORCL | $130.54 | $125.31-$135.75 | IN ZONE | MIXED | 22 |
| RKLB | $57.34 | $55.98-$60.64 | IN ZONE | MIXED | 9 |
| STX | $648.28 | $641.14-$694.56 | IN ZONE | MIXED | 10 |
| WDC | $384.99 | $365.64-$396.12 | IN ZONE | MIXED | 14 |
| GOOGL | $325.05 | $309.34-$321.96 | +1.0% | MIXED | 26 |
| HIMS | $28.24 | $26.75-$27.85 | +1.4% | QUIET | 24 |
| NVDA | $218.32 | $205.24-$213.62 | +2.2% | QUIET | 12 |
| TSM | $440.00 | $398.44-$414.70 | +6.1% | MIXED | 3 |
| PYPL | $55.83 | $50.48-$52.54 | +6.3% | MIXED | 9 |
| MU | $977.99 | $882.37-$918.39 | +6.5% | MIXED | 14 |
| INTC | $94.07 | $83.20-$86.60 | +8.6% | UPGRADE | 37 |
| EBAY | $117.93 | $103.33-$107.55 | +9.7% | MIXED | 78 |
| META | $618.49 | $527.96-$549.50 | +12.6% | MIXED | 18 |
| LYFT | $16.69 | $14.20-$14.78 | +13.0% | MIXED | 37 |
| BE | $224.49 | $183.71-$191.21 | +17.4% | MIXED | 13 |
| SKHY | $162.38 | $132.31-$137.71 | +17.9% | MIXED | 36 |
| MSFT | $529.05 | $390.61-$406.55 | +30.1% | MIXED | 15 |
| NOW | $153.44 | $102.06-$106.22 | +44.5% | MIXED | 9 |
Earnings tomorrow (4)
Implied move ±7.1% $109.51 – $126.36, from the Oct 30 straddle | Average move, last 8 ±6.9% bigger than implied in 4 of 8 |
Consensus EPS $1.41 revenue $3.11B | EPS record beat 8 of 8 avg move after beats −1.6% |
| Position | Rule set A P&L | Rule set B P&L | Rule set A · v2 P&L | Rule set B · v2 P&L | Δ (shares) |
|---|---|---|---|---|---|
| Put 120 · Nov 6 | +$25.00 | +$25.00 | — | — | ≈ −55 |
| Put 122 · Nov 6 | +$117.50 | +$117.50 | — | — | ≈ −60 |
| Put 120 · Nov 13 | — | — | +$45.00 | +$45.00 | ≈ −53 |
| Put 119 · Nov 13 | — | — | −$40.00 | −$40.00 | ≈ −51 |
| Short 83 shares | +$163.25 | +$163.25 | — | — | ≈ −83 |
| Short 82 shares | +$246.28 | +$246.28 | +$309.82 | +$309.82 | ≈ −82 |
| Short 84 shares | — | — | +$66.36 | +$66.36 | ≈ −84 |
Implied move ±5.8% $305.96 – $343.51, from the Oct 30 straddle | Average move, last 8 ±4.1% bigger than implied in 3 of 8 |
Consensus EPS $2.97 revenue $127.91B | EPS record beat 8 of 8 avg move after beats +0.4% |
Implied move ±5.0% $502.80 – $556.25, from the Oct 30 straddle | Average move, last 8 ±7.0% bigger than implied in 5 of 8 |
Consensus EPS $4.72 revenue $90.74B | EPS record beat 8 of 8 avg move after beats −0.2% |
Implied move ±10.5% $137.34 – $169.69, from the Oct 30 straddle | Average move, last 8 ±8.8% bigger than implied in 3 of 8 |
Consensus EPS $1.02 revenue $4.09B | EPS record beat 6 of 8 avg move after beats +2.3%, after misses −14.6% |
| Position | Rule set A P&L | Rule set B P&L | Δ (shares) |
|---|---|---|---|
| Put 155 · Nov 6 | −$207.50 | −$207.50 | ≈ −47 |
| Short 66 shares | −$340.05 | −$340.05 | ≈ −66 |
Earnings recap (1)
Implied move ±7.7% $51.54 – $60.09, from the Oct 30 straddle | Average move, last 8 ±8.0% bigger than implied in 4 of 8 |
Consensus EPS $1.31 revenue $8.71B | EPS record beat 7 of 8 avg move after beats −3.3%, after misses −20.3% |
Actual move vs implied +2.0% vs implied ±7.7%: fell short · open gap +0.8% · $54.99 → $56.09 | IV before → after 56% → 35% −21 pts, at-the-money |
| Position | Rule set A P&L | Rule set B P&L | Rule set A · v2 P&L | Rule set B · v2 P&L |
|---|---|---|---|---|
| Call 58 · Nov 6 × 4 | −$324.00 (stop hit) | −$324.00 | — | — |
| Call 57 · Nov 6 × 3 | −$229.50 (stop hit) | −$229.50 | — | — |
| Long 175 shares | +$192.50 | +$192.50 | — | — |
| Short 180 shares | — | — | −$122.40 (opened) | −$122.40 (opened) |
Oct 26, 2026 – Nov 1, 2026
Nov 2, 2026 – Nov 8, 2026