📌 TODAY'S FEATURED STOCK: EBAY
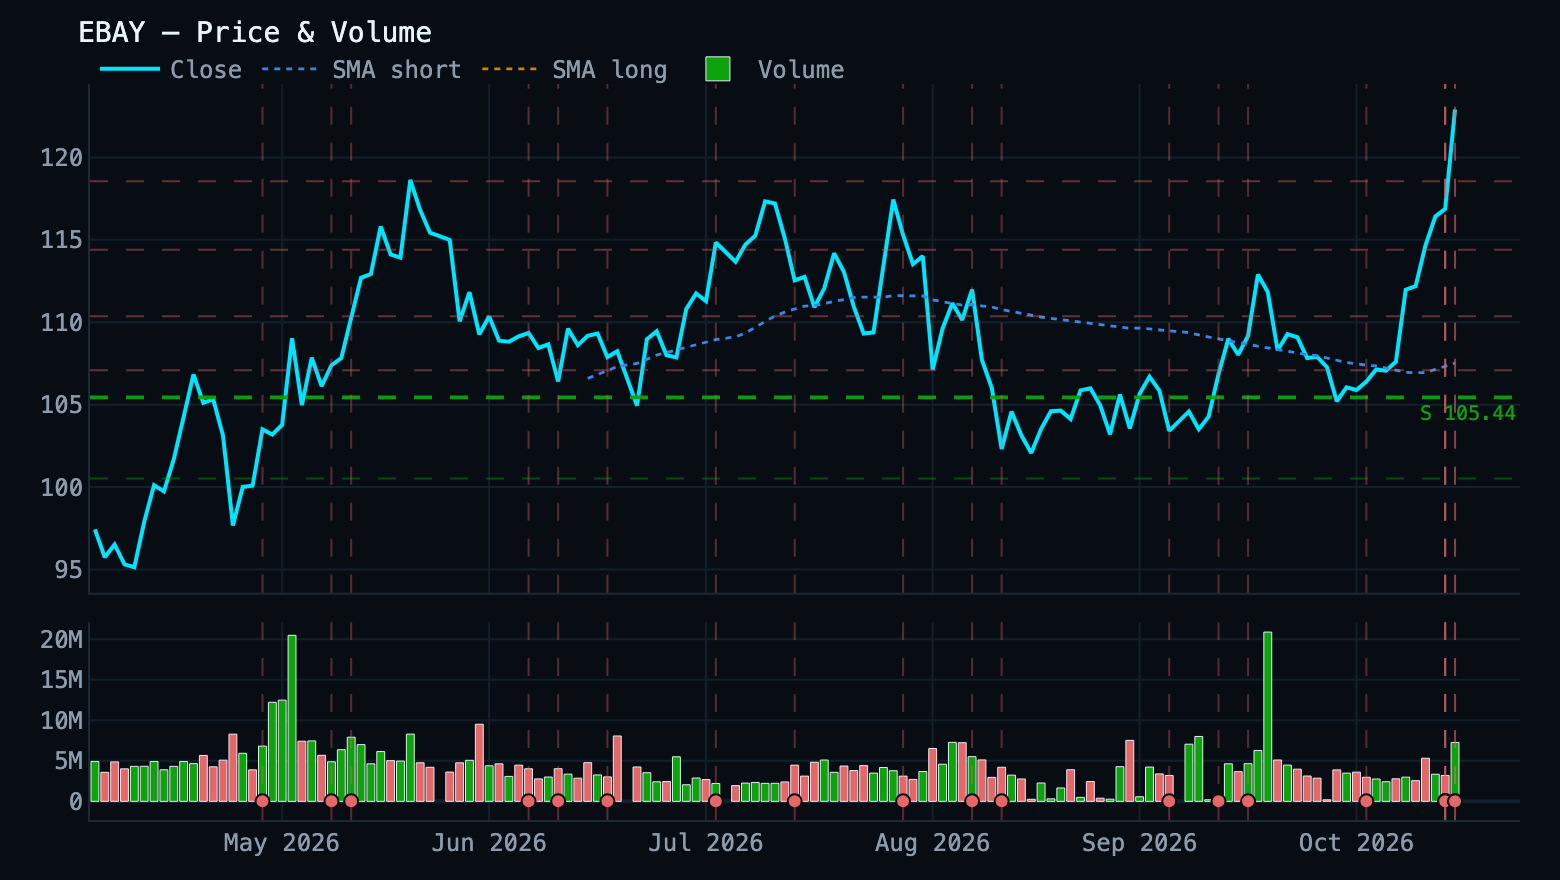
Current price: $123.20
Overview
EBAY trades at $123.20, up 0.2% on the day on 0.1× normal volume. It sits 1.1% below its 52-week high of $124.59 and is up 12.9% over the past month. Momentum is overbought — RSI 79 with MACD positive.
Key Stats
2-Week Swing Outlook
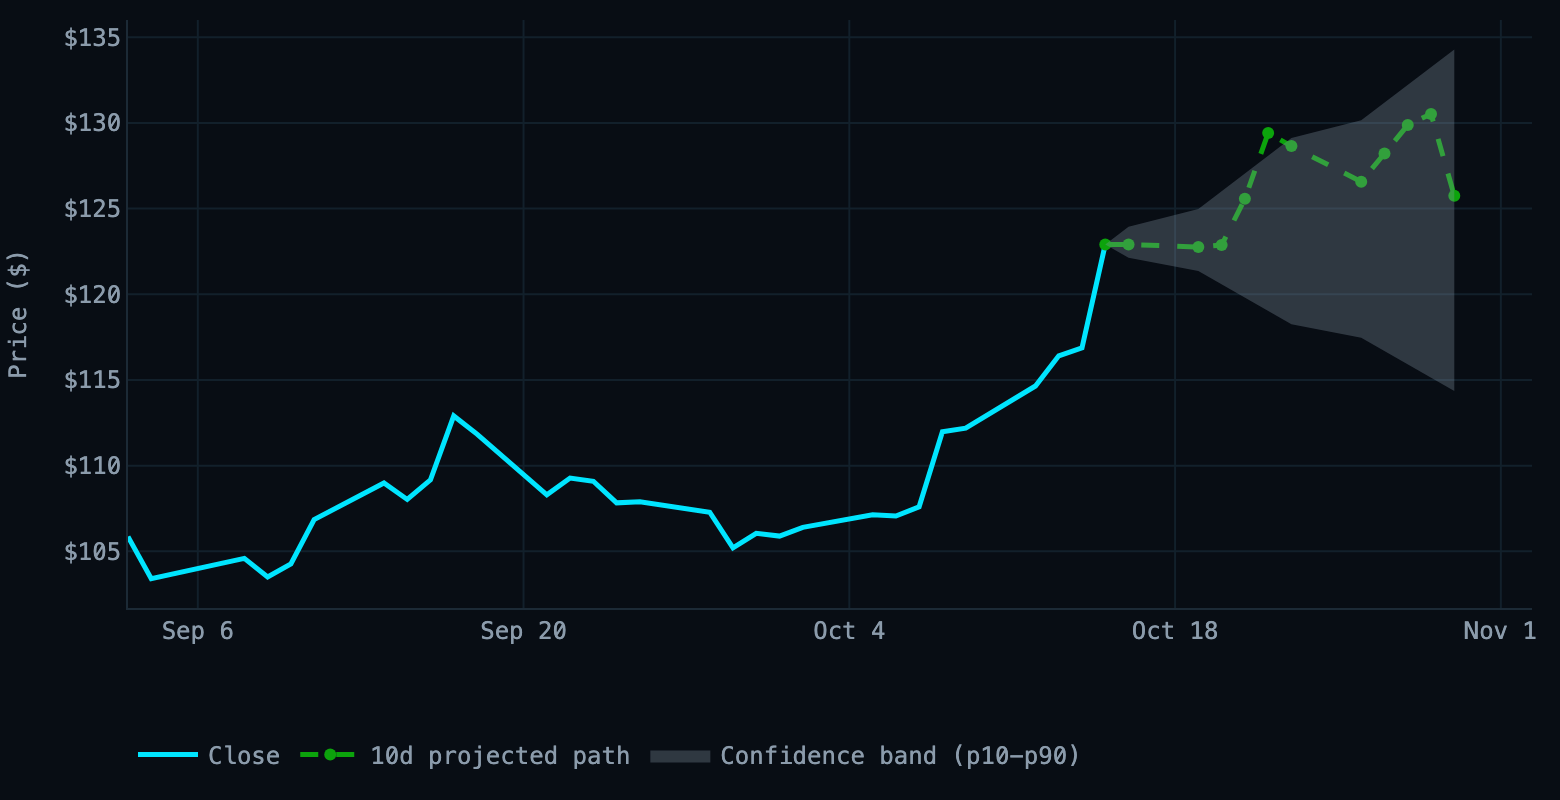
● UP — EBAY target $125.75 (+2.31%) by Oct 30, 2026 (10 trading days). Mode 3: trained model (0 reconciled 10-day session(s) on record).
Institutional Analysis
| Insider activity | 12 sell(s), 0 buy(s) (last 90d) — largest: Officer, $2.5M, Aug 5, 2026 |
| Buybacks | $2500M FY2025, down from $3149M FY2024 — ~4.57% of market cap |
| Analyst consensus | 27 analysts, Hold (mean 2.56) — target $116 vs $123 spot |
| Dark pool | 65.0% of volume, ELEVATED signal |
| Congressional | No trades on record |
Earnings
Latest reported (Aug 5, 2026): EPS Beat +6.67% / Revenue Beat +3.99%
News Summary
The dominant narrative is a takeover/ownership rumor, not fundamentals: eBay jumped 5% to a 52-week high on Oct 15, 2026 on what 247wallst.com framed as "Takeover Speculation" and app.moby.co bluntly called "a Recycled GameStop Rumor," with Etsy rallying 7% in sympathy. Yahoo Finance and MarketBeat followed up with "EBay's Stock Rally Hits a New High" and "Reaches New 1-Year High - Still a Buy?" pieces that are reactive to the move rather than sourcing new company news. One genuine fundamental item sits in the feed: a report that the UK will make online marketplaces collect seller VAT (retail-insight-network.com, Oct 15, 2026), a potential compliance/friction item for the platform. Trefis's "What Changed In eBay's Story?" is the only piece attempting a re-rating thesis, and the bundle provides no detail from it.
Outlook
- Next earnings (Nov 4, 2026): NEUTRAL (Medium confidence) — EBAY has beaten EPS in all eight quarters on record yet fell -15.88% on the Oct 29, 2025 beat — entering the print 6% above the $115.92 mean analyst target and 1.3% from the 52-week high leaves no cushion if guidance disappoints.
- End of this week (Oct 16, 2026): NEUTRAL (Medium confidence) — With RSI14 at 77.95, volume -90.4% vs. 20-day average, and the move driven by what app.moby.co called a recycled GameStop rumor, a denial or simple rumor fade could retrace a large part of the 9.43% five-day gain inside the $7.06 one-week expected move.
- End of this month (Oct 31, 2026): BEARISH (Low confidence) — Price above all detected resistance with the nearest real support at 105.44, consistent CEO selling (11,110 shares on both Oct 5, 2026 and Oct 6, 2026), declining FCF ($1.434B FY2025 vs. $1.956B FY2024) and shrinking buybacks argue for mean reversion — but a confirmed takeover headline would invalidate the bearish case outright.
Recent News
- Dow Jones Futures: Tesla Flies On Roadster As Investors Question Anthropic Valuation — finance.yahoo.com
- EBay’s Stock Rally Hits a New High. Why It’s Such a Big Winner This Year. — finance.yahoo.com
- eBay Jumps 5% to a 52-Week High on a Recycled GameStop Rumor — app.moby.co
- What Changed In eBay's Story? — trefis.com
- Albertsons follows Kroger in putting harsh cuts, store closures, in play — thestreet.com
Today's Runners (4)
- EBAY: $123.20 (+0.2%, 0.1× vol)
RSI 79 (overbought), MACD histogram positive and rising → short-term bullish bias, but stretched (overbought) - IREN: $28.91 (-4.9%, 0.3× vol)
RSI 24 (oversold), MACD histogram negative and falling → short-term bearish bias, but stretched (oversold) - SKHY: $138.86 (-5.0%, 0.4× vol)
RSI 28 (oversold), MACD histogram negative and falling → short-term bearish bias, but stretched (oversold) - STX: $659.63 (-4.5%, 0.1× vol)
RSI 29 (oversold), MACD histogram negative and falling → short-term bearish bias, but stretched (oversold)
Day Prediction targets (9)
| Ticker | Current | Target | Move | Dir | Conf. |
|---|---|---|---|---|---|
| ORCL ★ | $132.49 | $128.04 | -3.4% | ▼ | High |
| IREN | $28.91 | $28.12 | -2.7% | ▼ | Medium |
| NOW ★ | $146.97 | $143.13 | -2.6% | ▼ | High |
| SKHY | $138.86 | $136.20 | -1.9% | ▼ | Low |
| EBAY | $123.20 | $121.27 | -1.6% | ▼ | High |
| WDC ★ | $339.98 | $335.61 | -1.3% | ▼ | Low |
| MU ★ | $896.47 | $904.31 | +0.9% | ▲ | Low |
| STX | $659.63 | $661.30 | +0.3% | ▲ | Low |
Targets are model forecasts for today's 4:00 PM ET close, not guarantees. Confidence reflects backtest depth; per-ticker hit rates are in the dashboard.
Swing Forecast highlights (2)
- SKHY (10d): target $180.15 (UP)
- NOW (30d): target $157.88 (UP)
Watchlist Signals (full table) (15)
| Ticker | Price | Entry Zone | Distance | Signal | Div. Score |
|---|---|---|---|---|---|
| INTC 🔔 | $93.00 | $91.56-$99.18 | IN ZONE | QUIET | 32 |
| MU | $896.47 | $882.37-$918.39 | IN ZONE | MIXED | 21 |
| OKLO | $29.83 | $28.81-$31.21 | IN ZONE | MIXED | 16 |
| ORCL | $132.49 | $130.18-$135.50 | IN ZONE | QUIET | 23 |
| STX 🔔 | $659.63 | $663.18-$718.44 | -0.5% | QUIET | 27 |
| WDC 🔔 | $339.98 | $342.19-$370.71 | -0.7% | MIXED | 32 |
| IREN 🔔 | $28.91 | $29.17-$31.61 | -0.9% | QUIET | 6 |
| SKHY | $138.86 | $140.27-$151.95 | -1.0% | QUIET | 9 |
| HIMS | $29.60 | $26.79-$27.89 | +6.1% | QUIET | 33 |
| BE | $230.09 | $205.25-$213.63 | +7.7% | MIXED | 43 |
| PYPL | $57.54 | $50.48-$52.54 | +9.5% | MIXED | 35 |
| EBAY | $123.20 | $103.33-$107.55 | +14.6% | MIXED | 72 |
| LYFT | $17.14 | $14.20-$14.78 | +16.0% | MIXED | 26 |
| NOW | $146.97 | $100.55-$104.65 | +40.4% | MIXED | 20 |
Macro Calendar — This Week & Next Week
Oct 12, 2026 – Oct 18, 2026
Oct 19, 2026 – Oct 25, 2026