📌 TODAY'S FEATURED STOCK: IREN
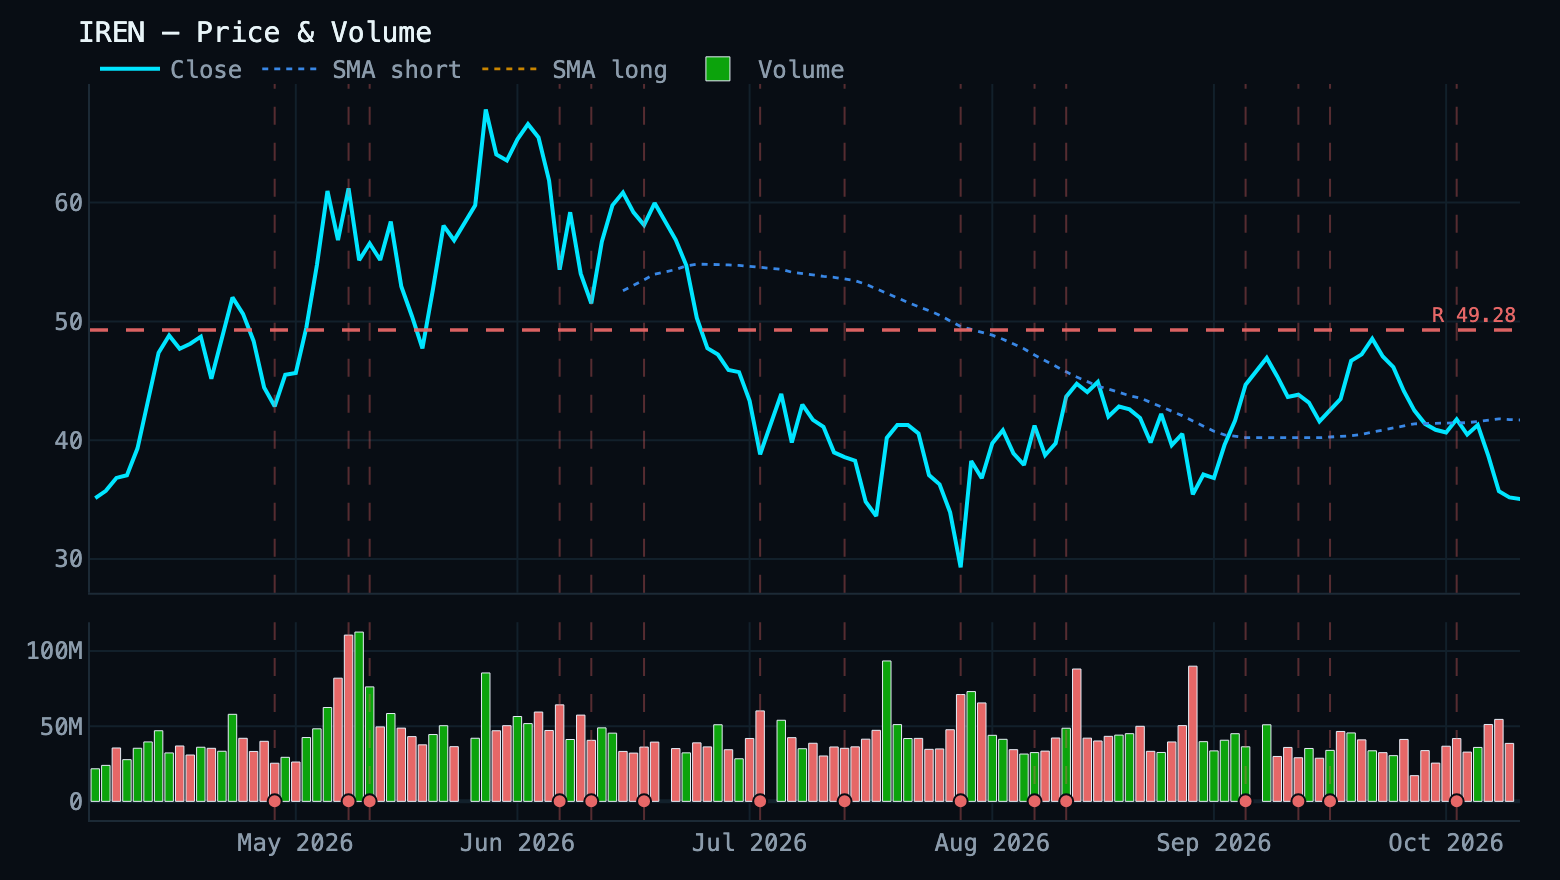
Current price: $30.51
Overview
IREN trades at $30.51, down 12.3% on the day on 1.7× normal volume. It sits 60.3% below its 52-week high of $76.87 and is down 29.3% over the past month. Momentum is oversold — RSI 27 with MACD still negative — and options are pricing a ±$0.06 (±0.2%) move over the next week.
Key Stats
Price
$30.51
down 12.3% today
Past month
-29.3%
a sharp drop
vs 52-week high
-60.3%
high was $76.87
Momentum (RSI)
27 out of 100
beaten down — sellers may be running out of steam
Trend direction
Fading
sellers are gaining ground
Trading volume
1.7× normal
busier than usual
Nearest floor
—
Nearest ceiling
$49.28
61.5% above — where sellers showed up before
Expected 1-week swing
±$0.06 (±0.2%)
what options traders are pricing in
Expected 2-week swing
±$0.08 (±0.3%)
what options traders are pricing in
2-Week Swing Outlook
Current price
$30.51
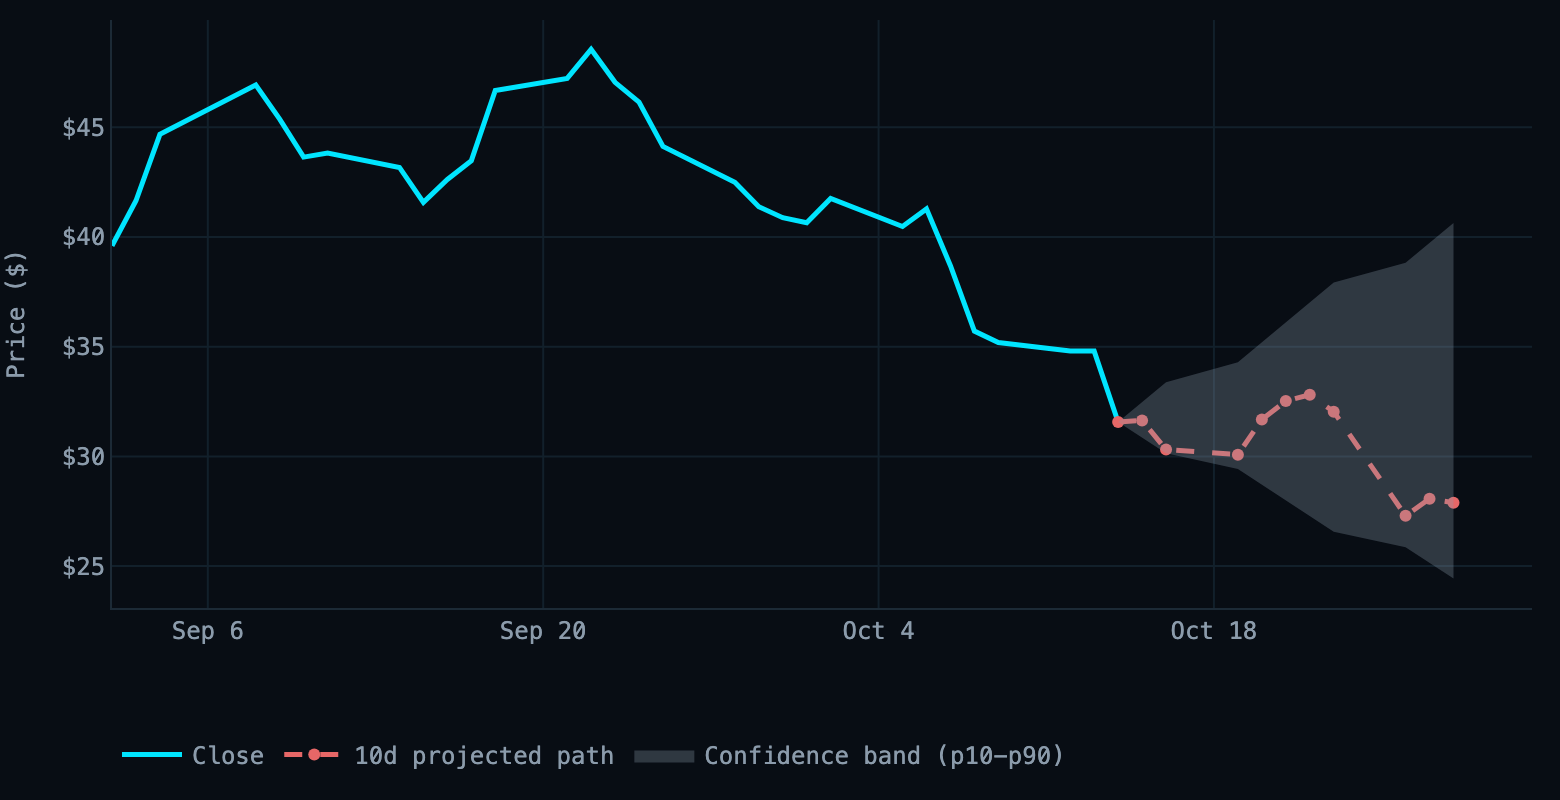
Target (10d, Oct 28, 2026)
$27.89
↓ -11.66%
Confidence band (p10–p90)
$24.43 – $40.64
Confidence
Medium
● DOWN — IREN target $27.89 (-11.66%) by Oct 28, 2026 (10 trading days). Mode 2: Bayesian (0 reconciled 10-day session(s) on record).
Earnings
Next earnings: Nov 5, 2026
Latest reported (May 8, 2026): EPS Miss -14.47% / Revenue Miss -34.09%
Latest reported (May 8, 2026): EPS Miss -14.47% / Revenue Miss -34.09%
Recent News
- Why CoreWeave Stock Tumbled Today — fool.com
- IREN Limited's AI Pivot Gains Traction—But Can Its Data Centers Deliver? — marketbeat.com
- IREN proposes 900 MW Redbank data center near Wagga Wagga, outside its secured-power portfolio — blockspace.media
- Cipher Digital Falls 5% as $850M Zero-Coupon Note Pricing Extends Slide; Applied Digital Declines 6%, IREN Drops 4% — 247wallst.com
- IREN's Redbank Campus Adds 900MW To Its Plans, But Power Is Not Secured Yet — stocktwits.com
Today's Runners (4)
- IREN: $30.51 (-12.3%, 1.7× vol)
RSI 27 (oversold), MACD histogram negative and falling → short-term bearish bias, but stretched (oversold) - BE: $241.37 (-8.4%, 0.9× vol)
RSI 42 (neutral), MACD histogram negative and falling → short-term bearish bias - ORCL: $130.21 (-9.1%, 1.3× vol)
RSI 40 (neutral), MACD histogram negative and falling → short-term bearish bias - SKHY: $148.22 (-5.6%, 1.0× vol)
RSI 32 (approaching oversold), MACD histogram negative and falling → short-term bearish bias
Day Prediction targets (8)
| Ticker | Current | Target | Move | Dir | Conf. |
|---|---|---|---|---|---|
| SKHY | $148.22 | $140.63 | -5.1% | ▼ | High |
| BE | $241.37 | $230.37 | -4.6% | ▼ | Medium |
| ORCL | $130.21 | $127.59 | -2.0% | ▼ | High |
| WDC ★ | $363.97 | $357.24 | -1.8% | ▼ | Medium |
| IREN | $30.51 | $30.07 | -1.5% | ▼ | Medium |
| MU ★ | $918.66 | $905.79 | -1.4% | ▼ | Medium |
| NOW ★ | $139.84 | $140.87 | +0.7% | ▲ | Low |
Targets are model forecasts for today's 4:00 PM ET close, not guarantees. Confidence reflects backtest depth; per-ticker hit rates are in the dashboard.
Swing Forecast highlights (2)
- SKHY (10d): target $180.15 (UP)
- NOW (30d): target $157.88 (UP)
Watchlist Signals (full table) (15)
| Ticker | Price | Entry Zone | Distance | Signal | Div. Score |
|---|---|---|---|---|---|
| HIMS | $27.65 | $26.84-$27.94 | IN ZONE | QUIET | 33 |
| INTC | $98.72 | $96.31-$100.25 | IN ZONE | QUIET | 32 |
| IREN | $30.51 | $30.31-$32.83 | IN ZONE | UPGRADE | 6 |
| OKLO | $29.00 | $28.75-$31.15 | IN ZONE | MIXED | 16 |
| ORCL | $130.21 | $130.18-$135.50 | IN ZONE | QUIET | 23 |
| SKHY 🔔 | $148.22 | $142.38-$154.24 | IN ZONE | QUIET | 23 |
| WDC | $363.97 | $357.44-$387.22 | IN ZONE | MIXED | 32 |
| MU | $918.66 | $882.37-$918.39 | 0.0% | MIXED | 21 |
| STX | $715.79 | $683.05-$710.93 | +0.7% | QUIET | 27 |
| PYPL | $56.15 | $50.48-$52.54 | +6.9% | MIXED | 35 |
| EBAY | $116.69 | $103.33-$107.55 | +8.5% | MIXED | 72 |
| LYFT | $16.40 | $14.20-$14.78 | +10.9% | MIXED | 26 |
| BE | $241.37 | $205.25-$213.63 | +13.0% | MIXED | 43 |
| NOW | $139.84 | $100.55-$104.65 | +33.6% | MIXED | 20 |
THIS WEEK
Oct 12, 2026 – Oct 18, 2026
Oct 12, 2026 – Oct 18, 2026
Mon, Oct 12, 2026
—Tue, Oct 13, 2026
—Wed, Oct 14, 2026
HIGHCPICore CPI MoM
+0.3% · Fcst +0.2% · Prev +0.3% +0.1 hot
Core CPI YoY
+2.6% · Fcst +2.5% · Prev +2.4% +0.1 hot
CPI YoY
+3.7% · Fcst +3.6% · Prev +3.4% +0.1 hot
CPI MoM
+0.6% · Fcst +0.6% · Prev +0.4% in line
Thu, Oct 15, 2026
HIGHPPIPPI MoM
Fcst +0.5% · Prev +0.4%
Core PPI MoM
Fcst +0.3% · Prev +0.2%
HIGHRetail Sales MoMFcst +0.3% · Prev +1.2%
MEDIUMInitial Jobless ClaimsFcst 200 · Prev 197
Fri, Oct 16, 2026
—Sat, Oct 17, 2026
—Sun, Oct 18, 2026
—NEXT WEEK
Oct 19, 2026 – Oct 25, 2026
Oct 19, 2026 – Oct 25, 2026
Mon, Oct 19, 2026
—Tue, Oct 20, 2026
—Wed, Oct 21, 2026
—Thu, Oct 22, 2026
MEDIUMInitial Jobless ClaimsFcst — · Prev —
Fri, Oct 23, 2026
—Sat, Oct 24, 2026
—Sun, Oct 25, 2026
—